1. Overview of ML analysis platform functions
In order to realize the basic information of data analysis and training data in the RAInS project (AI Accountability System Project: RAInS Project Website), Python will be used to build a machine learning analysis platform to help data analysis And data modeling. The platform will implement some functions: design a web version of the user interface to support interaction. Support for selecting data sets from the local, support for automated visual analysis, support for regression analysis and classification analysis, support for viewing training records, support for viewing the parameters and results of the training model and drawing. Generate the required JSON files, and can also predict new data sets, with anomaly detection, rule association and other detailed functions.
2. The framework and the interface of Python package
Please install the required Python package through Conda or Pip before use
1 | import os |
3. Program file directory

data: is used to store the training data set and the test data set
logs.log: Used to record the log information generated by the system during the operation of the platform
mlruns: The machine learning template record information used to manage training can be used in mlflow
main.py: The main program code of the machine learning analysis platform
4. Ideas and design
(1). The idea of the program
At the beginning, I hoped to realize a data flow that can capture the machine learning (ML) (basic information of training data, whether to process the training data, the real data that is actually input to ML after ML is deployed, and ML’s prediction of these real data As a result, predict the time it will take.) And try to obtain information as follows: Whether there is an abnormality during runtime, such as memory overflow, CPU overload, etc. Whether the hardware reports an error. There are also real input data format, abnormal size, etc. Then record these data and generate JSON file as an interface to complete other parts of the project. So I completed the capture of camera information, object movement time and abnormal information based on OpenCV. Soon, I realized a serious problem. Trying this work based on specific machine learning can only use specific methods and parameters. Machine learning does not use the same template or a standard to complete every task. Is there a general way to use a special method as a subset to meet the needs?
(2). Program design
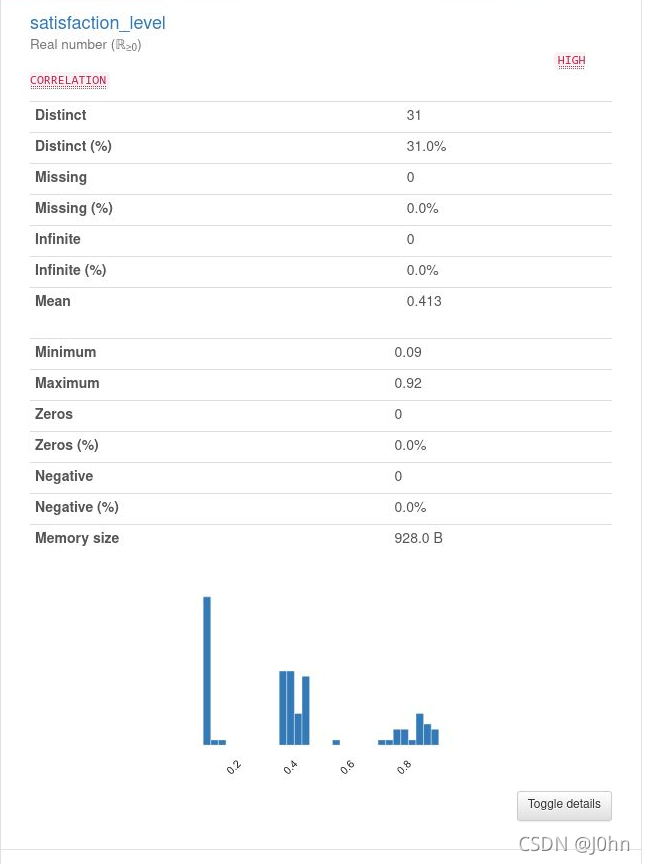
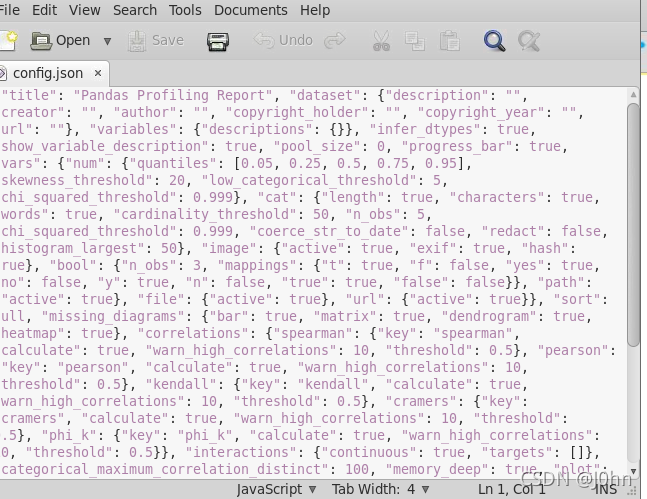
Machine learning is inseparable from the assistance and bonuses of data science. I use UCI data sets to obtain the data sources I need, and I can let developers define these data sets themselves, complete data definition and analysis through pandas-profiling, and visualize the original data of machine learning. And the generated report can be saved through JSON file. This operation provides information and help for engineers in later modeling and accountability.
The general process of machine learning is roughly divided into the steps of collecting data, exploring data, and preprocessing data. After processing the data, the next step is to train the model, evaluate the model, and then optimize the model.
To obtain information and records in a complete machine learning process, I used the pycaret library to complete machine learning modeling and analysis, and used regression analysis and classification prediction to implement machine learning analysis. First, get all the column names from the required data set, allowing developers to freely choose the information they need, and also need to get the algorithm according to the selected task. Finally, use pycaret to save the log of the entire process to the logs.log file.
For managing the entire model and predicting work, I thought of using mlflow (MLflow Website). The Tracking function in this tool can record every run The parameters and results, the visualization of the model and other data. I’m very surprised that the mlflow template has been included in pycaret. When I execute pycaret, I will automatically use mlflow to manage running records and logs. Model information, etc. You can get more model information and data by calling the load_model function in the template. Finally, it is very convenient that the developer only needs to input the data set to complete the prediction of the model.
MLflow is an end-to-end machine learning lifecycle management tool launched by Databricks(spark). It has the following four functions:
Track and record the experiment process, cross-compare experiment parameters and corresponding results (MLflow Tracking).
Package the code into a reusable and reproducible format, which can be used for member sharing and online deployment (MLflow Project).
Manage and deploy models from multiple different machine learning frameworks to most model deployment and reasoning platforms (MLflow Models).
In response to the needs of the full life cycle management of the model, it provides centralized collaborative management, including model version management, model state conversion, and data annotation (MLflow Model Registry).
MLflow is independent of third-party machine learning libraries and can be used in conjunction with any machine learning library and any language, because all functions of MLflow are invoked through REST API and CLI. In order to make the invocation more convenient, it also provides for Python, R , And Java language SDK.
Finally, in order to realize the visualization and UI interaction of the program, I used streamlit(Streamlit Website) to complete this work. The components contained in the streamlit library meet the needs of most developers, and only a single function is needed to complete the design and deployment of html in the design of web UI.
Streamlit is a Python-based visualization tool. Unlike other visualization tools, it generates an interactive site (page). But at the same time, it is not a WEB framework like Django and Flask that we often come into contact with.
The UI design of the platform is as follows:

5. Introduction to functions of the ML Platform
(1). Project deployment and data set reading analysis
First, we use git to clone the project in Github to the local with git clone repository. Use pip or Conda to complete the installation of the required Python package. Yes. Use the Python IDE to write or debug the program. Use streamlit to run the main.py program in the project. Enter ‘streamlit run main.py’ in the terminal. See the picture below The information shows that port 8501 has been opened (there will be a Network URL in the local URL), and we can use the program in the browser to enter the UI page.

Enter the browser, on the left page you can see four functions (define data source, data set analysis, modeling, view system log). The user needs to put the data set that the user needs in the ./data directory, Users can choose the model they need to complete machine learning training and modeling. Users can also choose the number of rows that need to be read, and can complete the visualization of the data set by generating a report. As shown in the figure:

The exploratory analysis of data will be divided into the following aspects:
- Are there missing values?
- Are there any outliers?
- Are there duplicate values?
- Is the sample balanced?
- Do you need to sample?
- Does the variable need to be converted?
- Do you need to add new features?

When developers need to use the data and records of this part of the platform, they can see all the configuration files about the system by selecting the Reproduction option, and can download the config.json file at any time to complete other Work.

(2). Machine learning modeling and viewing system logs
After the definition and analysis of the data source required by the user, modeling is now necessary. The project is very convenient for the modeling part of the function, and the usability is very high. The two most commonly used algorithms in data science are used in the modeling. : Regression and Classification. In my opinion, the biggest difference between these two algorithms is the different form of the loss function. The quantitative output is called the regression algorithm and belongs to continuous variable prediction. The classification algorithm is qualitative. It is a discrete variable forecast. Then developers can add model algorithms, such as xgboost, svm, lr and other common algorithms. Finally, the developer chooses to predict an object in the data set (currently the project cannot support simultaneous prediction of multiple objects, cross-validation, etc.). For this part of the function , Three lists are created in the code to store the modeling parameters that will be used.

After the machine learning modeling work is completed, developers can choose their own trained models and data sets, and can directly use the models. Developers can also view system logs to help analyze and improve. Users can choose to read and Check how many lines of system log. As shown in the figure:

6. Explanation of part of the code of the ML Platform
There are multiple functions with auxiliary functions before the main function:concatFilePath(file_folder, file_selected) is used to get the full path of the data, and then read the data set:
1 | # get the full path of the file, used to read the dataset |
Read logs.log in the getModelTrainingLogs(n_lines = 10) function, and display the number of lines selected last. The user can set the number of lines:
1 | # read logs.log, display the number of the last |
Finally, for the performance of the program, the data set will be put into the cache in the function load_csv to load the data set. Repeated loading of the previously used data set will not repeatedly occupy system resources again.
1 | # load the data set, put the data set into the cache |
7. Full code presentation of the ML Analysis Platform
1 | """ |
The demo video link of the project is as follows:
Finally, this project thanks my mentor Wei Pang for academic guidance and Danny for his technology help.
Copyright Notice
This article is the original content of Junhao except for the referenced content below, and the final interpretation right belongs to the original author. If there is any infringement, please contact to delete it. Without my authorization, please do not reprint it privately.
8. References
[1]. Kaggle XGboost https://www.kaggle.com/alexisbcook/xgboost
[2]. Kaggle MissingValues https://www.kaggle.com/alexisbcook/missing-values
[3]. MLflow Tracking https://mlflow.org/docs/latest/tracking.html
[4]. Google AutoML https://cloud.google.com/automl-tables/docs/beginners-guide
[5]. 7StepML https://towardsdatascience.com/the-7-steps-of-machine-learning-2877d7e5548e
[6]. ScikitLearn https://scikit-learn.org/stable/getting_started.html#model-evaluation
[7]. UCIDataset https://archive.ics.uci.edu/ml/datasets.php
[8]. Wikipedia https://en.wikipedia.org/wiki/Gradient_boosting
[9]. ShuhariBlog https://shuhari.dev/blog/2020/02/streamlit-intro